What Algorex Liquidity Radar shows
What Algorex Liquidity Radar does and what it shows on your chart.
Written By Algorex Trading Support
Last updated About 12 hours ago
Algorex Liquidity Radar shows where the liquidity sits in the trading day and which of it has already been taken.
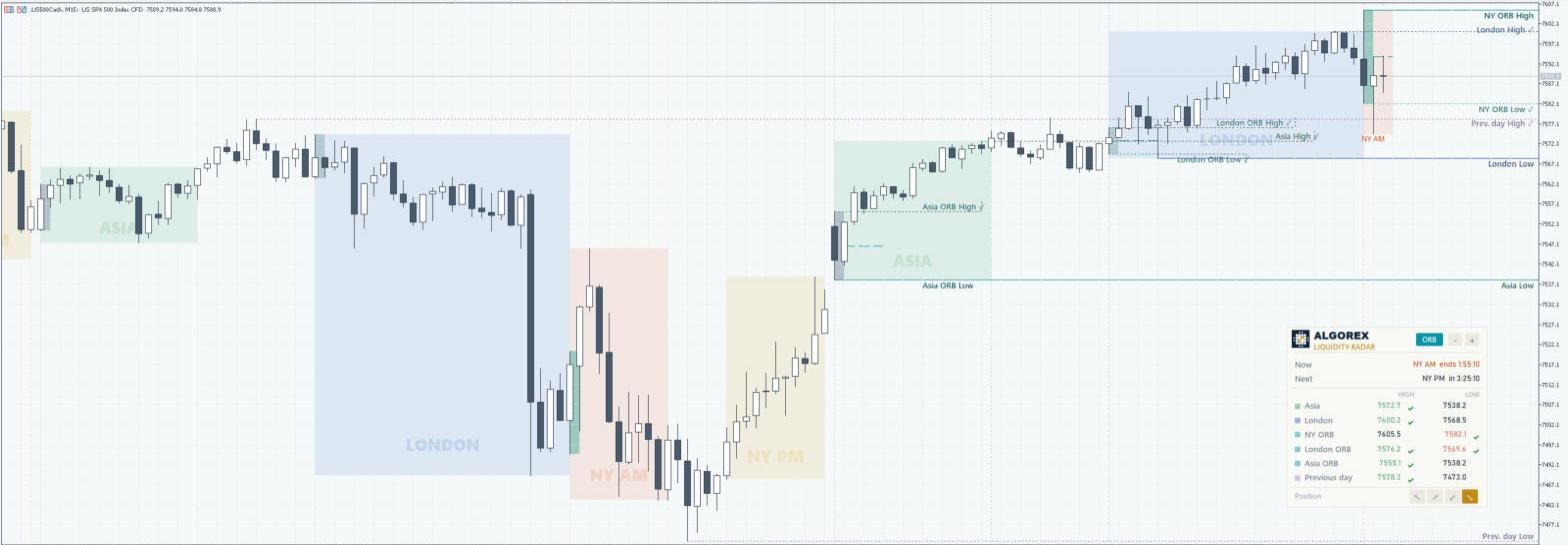
Many traders place their stop orders just beyond the high or the low of a session. Price is often drawn to them. The Radar draws these levels automatically and shows which have already been reached and which are still open.
Sessions as quiet zones
Asia, London, New York AM, New York Lunch and New York PM as soft pastel zones with the session name as a watermark
Thin vertical lines where each session starts and ends
All times are New York time, summer time is handled automatically
Liquidity levels
High and low of every session and of the previous day
An open level runs to the right edge of the chart as a solid line until price takes it
A taken level turns dotted, stops at the candle that took it and is marked with a check
Labels are placed automatically in free space, never on top of candles
Opening ranges (ORB)
New York (09:30), London (03:00) and Asia (20:00), each 5, 15, 30 or 60 minutes
ORB high, low and midpoint; the midpoint stays visible while the range is unbroken
Switch each ORB on or off with one click in the panel
The panel
Active session and countdown to its end, next session and countdown to its start
High and low of every session, ORB and the previous day; taken highs in green, taken lows in red, each with a check mark
Light pastel theme or navy theme, size and corner adjustable
Optional alerts when a level is taken
It is not a signal, but the state of the map: which side has been cleaned up, where business is still waiting.
Where to get it
TradingView: tradingview.com/script/vxvcXzma-Algorex-Liquidity-Radar/
MetaTrader 5: mql5.com/en/market/product/207771
MetaTrader 4: mql5.com/en/market/product/207773
Was this helpful?
Still need help? Share an idea